
In any business, it is important to understand who your customers are to better speak to them through advertising and throughout the pages and content on your website. When interacting with users digitally, you aren’t going to necessarily meet users personally, so in order to get to know them, you’ll need to utilize certain tools like Google Analytics. Whether you still need to add this tool to your website, or your website developer integrated it for you – if you don’t know how to read or use it, you are missing out on information that could elevate your digital presence and advertising campaigns.
What is Google Analytics and What Does it Provide?
Google Analytics is a hosted web analytics tool that collects and reports data about websites and their visitors. The tool is important in order to truly use your business’ website to its full potential, giving you the most from your investment. It helps you identify who your visitors are, how they find your site, how your site content is performing, and when the visitors convert into customers. All of this information is simple to access by placing a bit of code into the back-end of your website.
Understanding Google Analytics Dimensions & Metrics
The analytics tool provides you with dimensions, which are attributes or characteristics of your site’s visitors, as well as metrics measurements associated with your visitors.
- Dimensions Include:
- Geography & language
- Traffic source
- Browser technology & page load time
- Pages & navigation
- Internal Site Search (if activated)
- Goal completions (if activated)
- Campaign
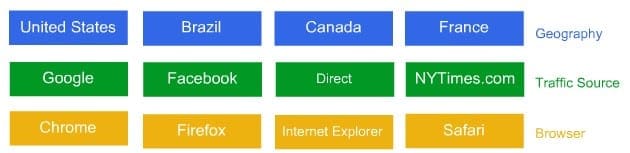
Each dimension is automatically and neatly organized into relevant groups or segments (see example below):
- Metrics Include:
- Audience – Sessions or users
- Engagement – Pages/visit
- Conversion rates
How Do I Read the Information on my Analytics?
While the tool provides you with quite a bit of indispensable information, it is useless if you do not understand what it means. Many of the dimension information is straight forward, such as seeing where visitors are from. However, the metrics can be confusing if you do not understand what they fully include.
- Sessions: Sessions essentially refer to visits. A session is the period of time a user is actively engaged with a website or app within the chosen date range. All usage data (screenviews, events, ecommerce, etc.) is associated with a session.
- Users (visitors): These are people who have had at least one session within the selected date range, and the number includes both new and returning users.
- Pageviews: This number indicates the total number of pages viewed on the website. Repeated views of a single page are counted.
- Average Session Duration: As the name suggests, this is simply the average length of a session on the website.
- Bounce: A bounce simply means there was only a single pageview, or a single even trigger in a visit.
- Bounce Rate: This provides the percentage of single page visits. In looking at this number, you want a very low percentage rate – ideally 0% – as this indicates users are staying on your site for an extended time rather than getting to it and leaving immediately or after a brief time.
- Entrance: The “entrance” is the first page a user views upon entering a website.
- Exit Page: The last page a user views before exiting the site.
- Conversions: This could mean several things based on your business goals – whether a user completes a purchase, signs up for a newsletter, requests information be sent to them, or more.
Some of these metrics can be easily confused for one another. For instance, when you hear about “Bounce Rate” and “Exit Rate.” The exit rate indicates the percentage of pageviews to a specific page that were the final within a session. The bounce rate shows the percentage of sessions that start on a specific page and were the only page viewed in a session, indicating the user did not go elsewhere on the site.
Understanding Complex Segments
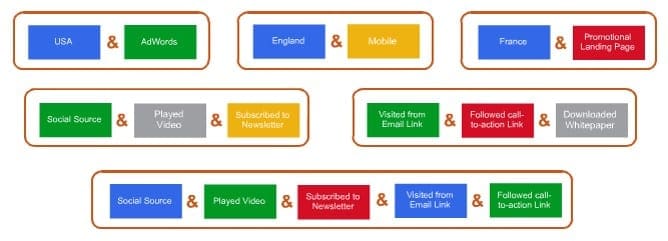
Complex segments within the reporting can help you dive even deeper into the visitors to your site. For example, you can see the city users come from then broken down into how they found your website, as well as info into their session durations and bounce rate. The complex segments are important as they can help you better determine how to direct your advertising messages and goals to specific users, such as encouraging users who find you through a social source to view your video and subscribe to your newsletter as that had shown success. Below is an example of complex segments broken down:
You can also use the Google Analytics URL Builder to add UTM codes to specific website URLs, which will allow you to track users who click on the specific link. These are great to use for digital ads as it will show you the information based on those who saw your ad and decided to click to your site from there.
Tracking On-Site Conversions
Analytics can also be used to set up and track on-site conversions. Tracking conversions is important in providing you with real evidence that your campaign goals are working, or perhaps if they aren’t working as well as you anticipated. Conversions could be based on:
- Destination: A specific location loads, such as a “Thank you for registering!” web page or app screen.
- Duration: This shows sessions that last a specific amount of time or longer, such as 10 minutes or more on a support site.
- Pages/Screens per Session: An action that is defined as an Event is triggered, like a social recommendation, video play, or ad click.
The information that is provided via Google Analytics is essential to any digital presence or advertising campaign. Having an accurate view of your site’s performance will allow you to tailor your messages and website for a better experience for new and returning customers. The information is available for you to view and use – don’t let your investment into a website go to waste! To learn more about your Google Analytics, or to get started, contact us today.
